In this collaborative research project, the main goal was to explore the Census 2020 outreach activities and evaluate community participation by developing and maintaining real-time web maps from the big data collected from the partners, managing a web platform, and performing data analysis of those activities.
In collaboration with the Illinois Department of Human Services, the Urban Data Visualization Lab (UDVL) embarked on a comprehensive initiative to boost participation in the 2020 Census. This collaborative project aimed to ensure that every voice in Illinois was counted, recognizing the crucial role census data plays in determining federal funding, political representation, and social services.
The project had several key components:
1. The creation of projections for response rates based on a statistical model called Map‐The‐Count (MTC) by developing projections at the census tract level allowed UDVL to provide insights into expected participation rates. These projections helped target areas that were historically underrepresented.
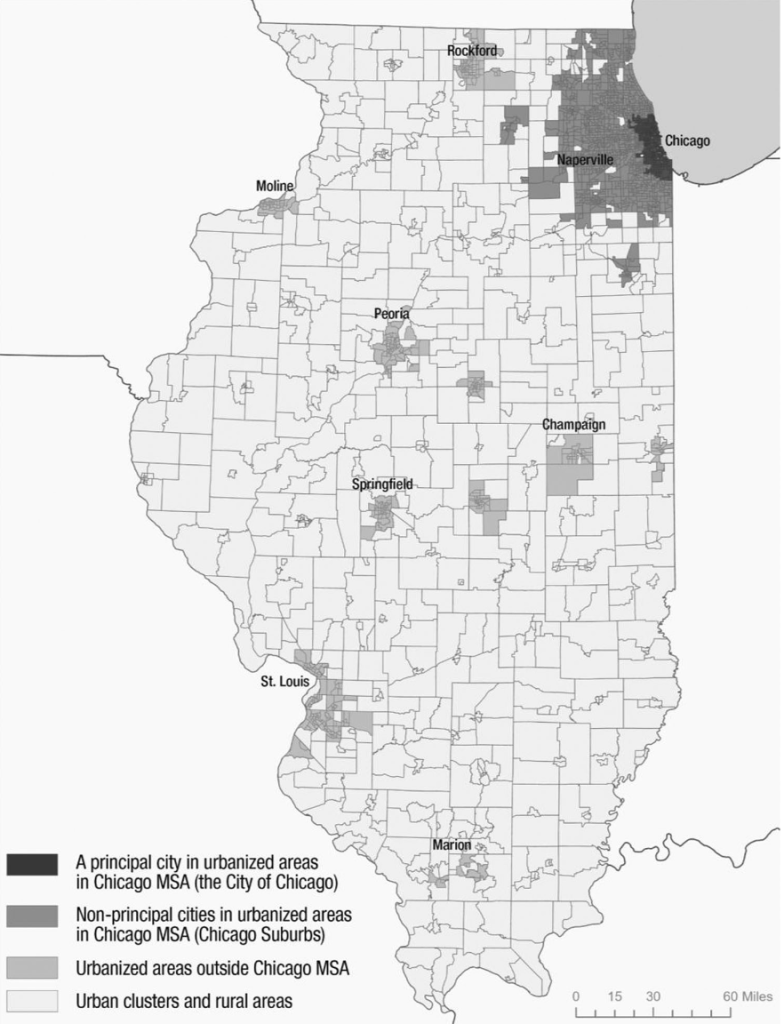
Source: Shin et al. 2022
Source: Carlson et al. 2021
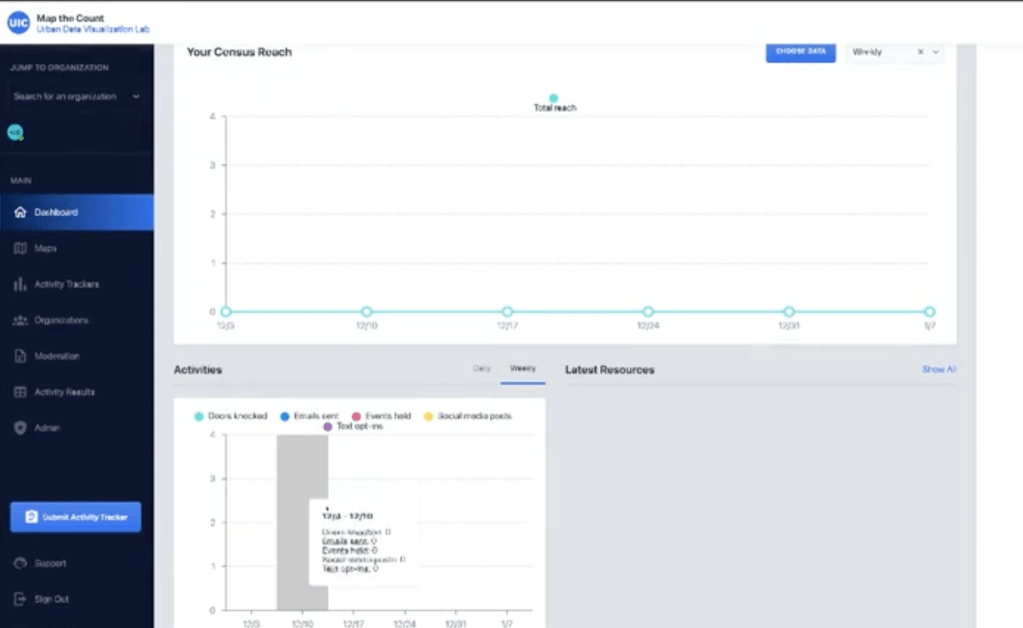
2. A user-friendly online web-based reporting tool was developed for reporting state-sponsored outreach activities. This facilitated efficient tracking and evaluation of various initiatives across Illinois.
3. After that, a dedicated website was created to serve both project grantees, elected officials, and the public. This platform provided vital information, tools, and resources to aid in census participation and outreach efforts.
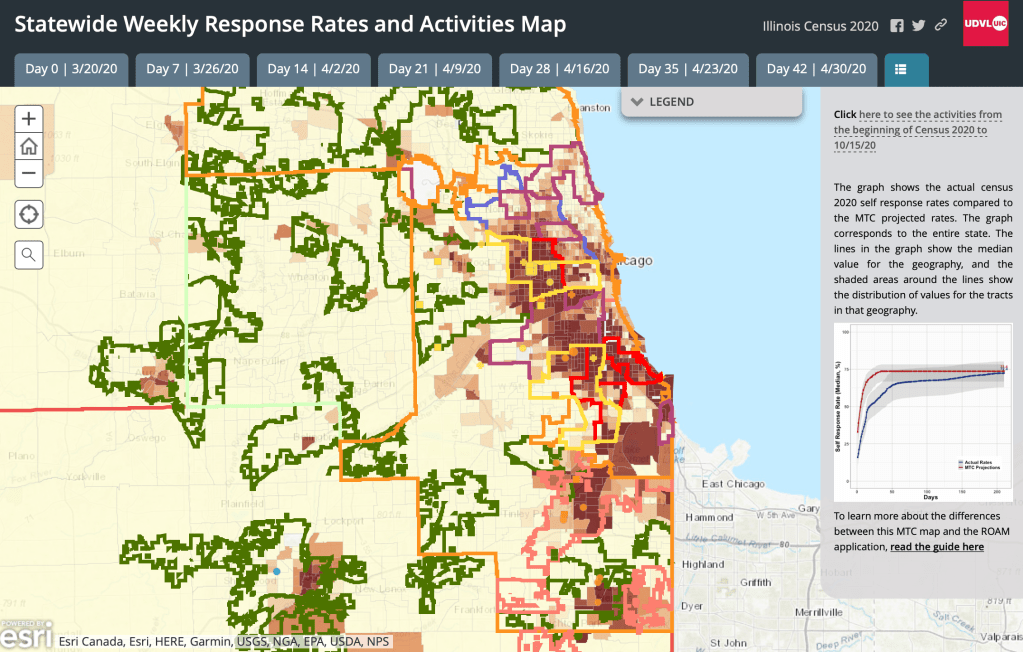
Source: UDVL; designed and created by Anton Rozhkov

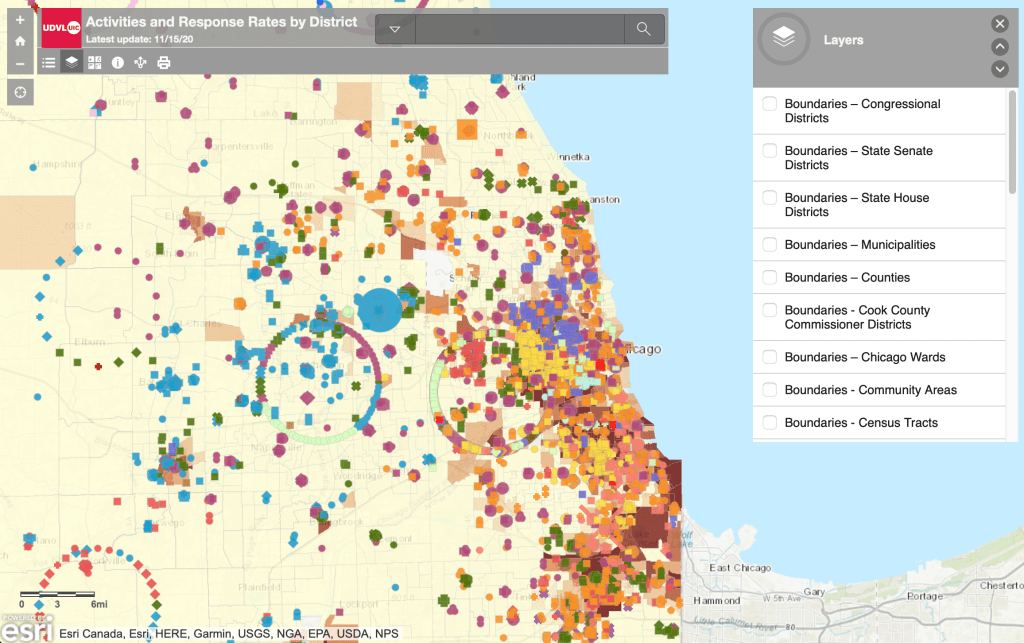
Source: Rozhkov et al. 2023
4. Finally, effective assessment tools were created, utilizing advanced data collection technologies and machine learning techniques, tools were created to assess the effectiveness of past outreach activities and guide future efforts. These tools helped refine strategies for better outcomes in diverse communities.
Key findings and results:
The U.S. Census Bureau’s Low Response Score (LRS) was a significant advancement in predicting census self-response participation. However, the UDVL’s research highlighted the importance of accounting for geographic differences. The study showed that census participation is influenced by both inter- and intrastate locational and socioeconomic differences. By leveraging machine learning techniques like k-means clustering, random forest, and gradient boosting and further investigation of feature importances, the study provided valuable insights into the impact of the Census outreach activities.
Key observations include:
- Socio-demographic characteristics were found to be more influential on response rates than the outreach activities themselves. In some underperforming areas, a high number of outreach activities did not correlate with increased response rates.
- “Direct engagement” and “Single events” are types of outreach activities that have the highest impact, particularly in low-income minority communities in metropolitan areas.
- The study’s results underscore the need for tailored outreach campaigns that consider both geographic differences and the unique socio-demographic profiles of various neighborhoods. A localized approach can enhance the effectiveness and impact of census participation initiatives, ensuring a more accurate and representative count.
- The Census 2020 Outreach Project by UDVL and IDHS exemplifies how data-driven strategies and advanced analytics can improve public participation in critical national activities. By addressing geographic and socio-economic disparities, the project not only boosted census response rates but also provided a model for future outreach efforts across the country and beyond.
The project was conducted by Urban Data Visualization team in Fall 2019 – Fall 2020.
Tools used: [ESRI ArcGIS] [Machine learning – Python]
Relevant publications:
- Rozhkov, A., Zandiatashbar, A., Massey, D., Shin, J., Smith, J., & Zellner, M. (2023). Effectiveness variation of different census outreach activities: An empirical analysis from the state of Illinois using machine learning and user interface technologies for participatory data collection. Applied Geography, 154, 102928. https://doi.org/10.1016/j.apgeog.2023.102928
- Shin, J., Zandiatashbar, A., Massey, D., Rozhkov, A., Smith, J., & Zellner, M. (2022). Intrastate applicability of National Census Response Rate Models: The case of the 2020 Census in the state of Illinois, United States. Population, Space and Place, 28, e2608. https://doi.org/10.1002/psp.2608
- Research report: Carlson, K., Creuzer, M., Leffert, W., Massey, D., Radloff, N., Rozhkov, A., Shin, J., Zandiatashbar, A., & Zellner, M. (2021). “Census 2020 and UDVL: Illinois State Resources.” University of Illinois Chicago. https://doi.org/10.25417/uic.13541990.v2
