In collaboration with the University of Illinois System’s Institute of Government and Public Affairs (IGPA), the Urban Data Visualization Lab (UDVL) embarked on a comprehensive initiative to assess the populations in Illinois most at risk during the COVID-19 pandemic. The project involved integrating data from various sources, managing a web platform (using ESRI ArcGIS Online portal) for real-time updates, and performing comprehensive data analysis to inform public health and economic support strategies. This project aimed to provide crucial insights into how different communities were affected by the disease and its economic consequences, guiding targeted responses to protect the most vulnerable residents of the state.
The project focused on developing COVID-19 Vulnerability Maps to identify the populations in Illinois most susceptible to both the health and economic impacts of the pandemic. This tool, featured in the first Policy Spotlight of IGPA’s Task Force on the Impact of the COVID-19 Pandemic, highlights areas where people are at heightened risk from both the virus and its economic fallout.
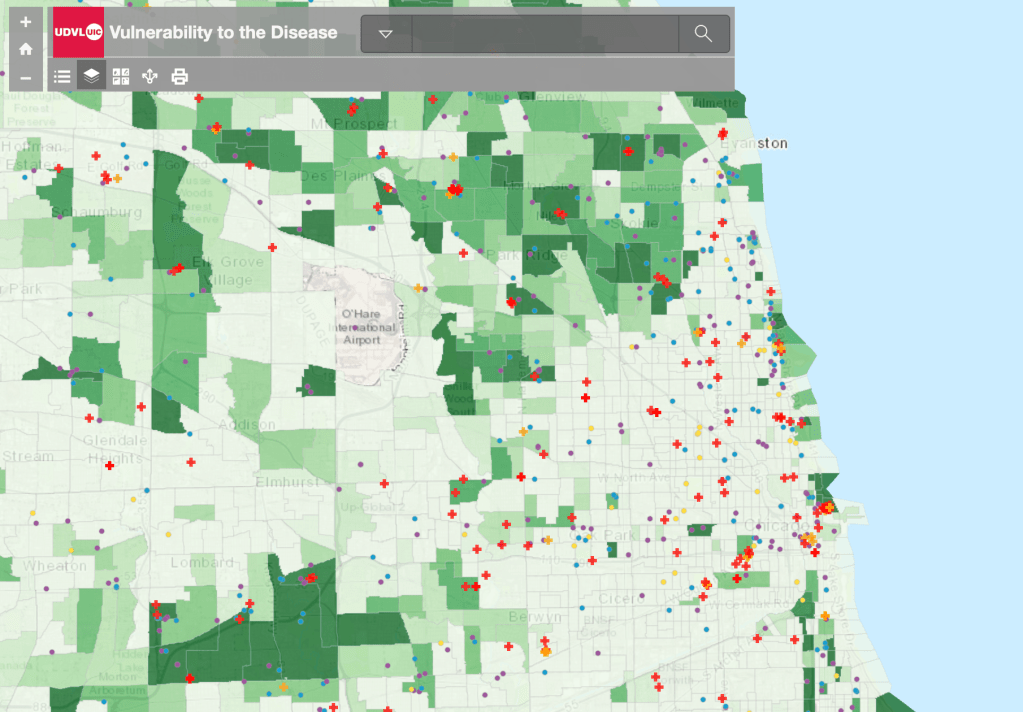
By overlaying data such as poverty rates and the locations of small businesses, the maps provide a detailed understanding of the socioeconomic and health vulnerabilities in different regions, guiding policymakers in making informed decisions. The initiative aims to ensure that the human toll of the pandemic is accounted for in decision-making processes, alongside public health and economic data, thereby helping to protect the most at-risk communities from disproportionately bearing the pandemic’s impact. The maps highlighted groups such as seniors, nursing home residents, and the homeless, who were at higher risk of severe health outcomes, and also identified populations vulnerable to economic hardships, including low-income residents and small businesses.
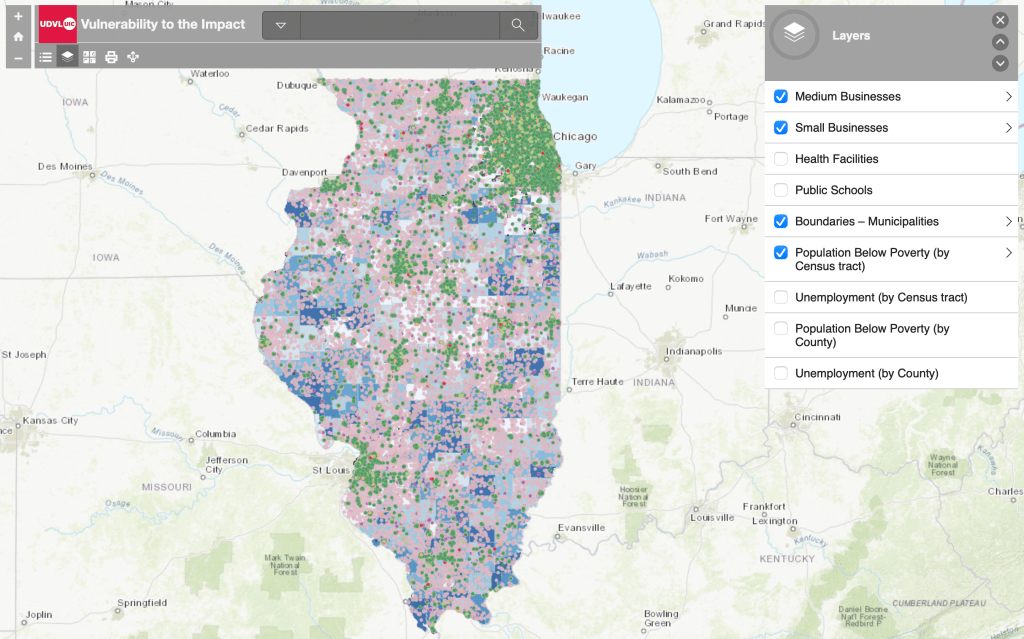
This distinction between health and economic vulnerability was crucial because the pandemic’s effects were multifaceted, requiring tailored responses. Health vulnerabilities needed to be understood in relation to healthcare infrastructure, ensuring that those at greatest risk were in proximity to necessary medical services. Meanwhile, economic vulnerabilities needed to be mapped separately to guide support for the most financially impacted communities. The map below shows small and medium businesses and poverty rates.
The analysis was underpinned by data from the 2018 American Community Survey and the 2018 Infogroup database and conducted in collaboration with the University of Illinois (UI) System’s Institute of Government and Public Affairs (IGPA).
The project was conducted by Urban Data Visualization Team in Spring 2020.
Tools used: [ArcGIS Online]
